
This article is for informational purposes only and is not a substitute for professional medical advice. Always consult your doctor before making changes to your treatment plan.
Did you know that about 38% of adults in the United States have high cholesterol? It’s one of the most common health issues doctors track — and the numbers that count as “normal” actually shift as you get older. For most people, cholesterol rises gradually until around age 60, then levels off or even dips slightly.
Men often see their numbers peak in their 50s. Women, on the other hand, tend to see a sharp jump in LDL cholesterol after menopause, when the protective effect of estrogen fades. Understanding these patterns — and where your own numbers fall on a cholesterol levels by age chart — is one of the simplest ways to stay ahead of your heart health.
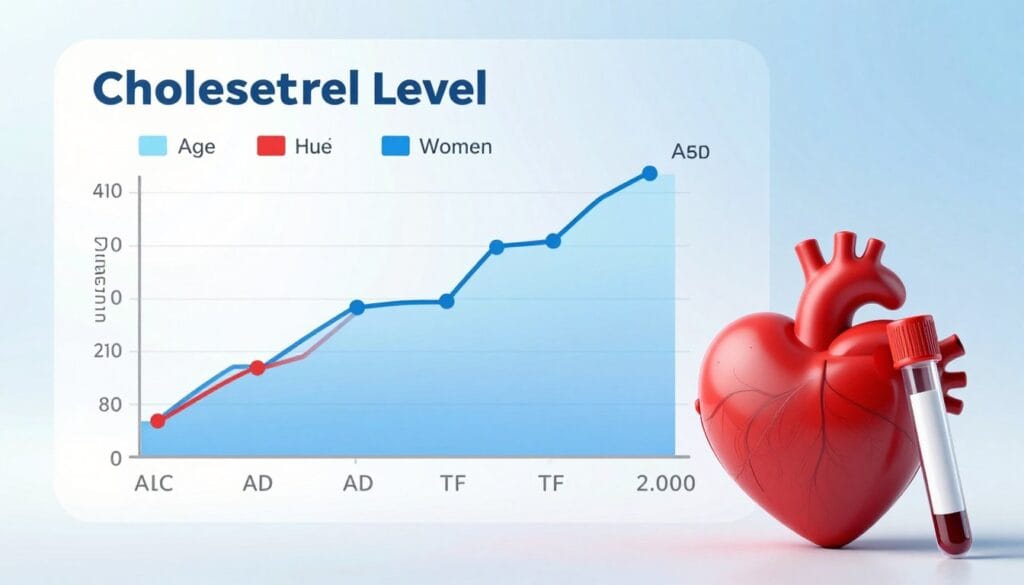
This guide breaks down normal ranges for total cholesterol, LDL, HDL, and triglycerides by age and sex, based on AHA/JACC guidelines and population research data, so you can see exactly how your lab results compare on a cholesterol levels by age chart.
Key Takeaways
- About 38% of American adults have high cholesterol.
- Cholesterol levels naturally rise with age until around 60, then tend to plateau or decline slightly.
- Men often see cholesterol peak in their 50s.
- Women typically see LDL rise 10–20 mg/dL within a few years after menopause.
- A cholesterol levels by age chart helps you interpret your personal lab results in context — but your doctor should always factor in your individual risk profile too.
Understanding Your Lipid Profile
A lipid panel is the blood test that measures your cholesterol. It’s a standard part of most check-ups from age 20 onward, and it breaks your results into four numbers:
- Total Cholesterol — the overall amount of cholesterol in your blood.
- LDL (Low-Density Lipoprotein) — often called “bad” cholesterol, because it can build up in artery walls.
- HDL (High-Density Lipoprotein) — the “good” cholesterol that helps clear excess fat from your bloodstream.
- Triglycerides — a different type of fat, measured in the same test, that stores energy but raises heart disease risk at high levels.
Why Fasting Matters Before Your Blood Test
Most doctors ask you to fast for 9–12 hours (water only) before a lipid panel. Eating beforehand can temporarily raise triglycerides and skew your LDL reading, which may lead to an inaccurate picture of your heart health. If you’re unsure whether your particular test requires fasting, ask your provider when you schedule it.
The AHA/JACC 2018 Guidelines, Explained
The American Heart Association (AHA) and American College of Cardiology (JACC), in their 2018 guidelines, set the reference ranges most U.S. doctors use to assess cardiovascular risk. All values below are in mg/dL, based on a fasting blood draw.
Total Cholesterol and LDL
| Category | Total Cholesterol (mg/dL) | LDL Cholesterol (mg/dL) |
|---|---|---|
| Optimal | Less than 200 | Less than 100 (below 70 if heart disease is present) |
| Borderline High | 200–239 | 130–159 |
| High | 240 and above | 160 and above (190+ is very high) |
HDL Cholesterol
| Category | HDL Level (mg/dL) |
|---|---|
| Low (increased risk) | Below 40 (men) / below 50 (women) |
| Acceptable | 40+ (men) / 50+ (women) |
| Optimal | 60 or higher |
Triglycerides
| Category | Triglycerides (mg/dL) |
|---|---|
| Normal | Less than 150 (ideal is under 100) |
| Borderline High | 150–199 |
| High | 200 and above (500+ is very high) |
Keep in mind: these are population-level benchmarks. A cholesterol levels by age chart helps put these numbers in context, but your doctor will also weigh your age, family history, blood pressure, and lifestyle before setting a personal target.
Cholesterol Levels by Age Chart: A Detailed Breakdown
Cholesterol doesn’t stay static through life — it shifts with age, hormones, and lifestyle. Below is a cholesterol levels by age chart showing average values by age group and sex, based on population health research. These are averages, not fixed targets — your doctor will still use the AHA/JACC categories above to judge whether your specific number is a concern.
Total Cholesterol by Age (mg/dL)
| Age Group | Men | Women |
|---|---|---|
| Under 30 | ~164 | ~161 |
| 30–39 | ~177 | ~174 |
| 40–49 | ~184 | ~186 |
| 50–59 | ~184 | ~192 |
| 60–69 | ~179 | ~198 |
| 70 and older | ~179 | ~199 |
Notice how men’s average total cholesterol levels off in their 50s, while women’s numbers keep climbing well into their 60s and 70s — a pattern closely tied to the hormonal changes of menopause.
LDL Cholesterol by Age (mg/dL)
| Age Group | Men | Women |
|---|---|---|
| Under 30 | ~94 | ~90 |
| 30–39 | ~101 | ~99 |
| 40–49 | ~105 | ~106 |
| 50–59 | ~106 | ~110 |
This section of the cholesterol levels by age chart focuses on LDL, the number doctors watch most closely.
HDL Cholesterol by Age (mg/dL)
| Age Group | Men | Women |
|---|---|---|
| Under 30 | ~44 | ~48 |
| 30–39 | ~43 | ~49 |
| 40–49 | ~44 | ~51 |
| 50–59 | ~46 | ~51 |
| 60–69 | ~47 | ~54 |
| 70 and older | ~48 | ~57 |
Women tend to maintain a natural HDL advantage over men at every age — one reason heart disease often shows up later in women than in men, until menopause narrows that gap. This pattern is visible throughout the cholesterol levels by age chart above.
Why LDL Cholesterol Matters So Much
LDL earns its “bad cholesterol” reputation because it can deposit into artery walls over time, forming plaque — a process called atherosclerosis. As plaque builds up, arteries narrow, making it harder for blood (and the oxygen it carries) to reach your heart and brain. This is why LDL is usually the number your doctor watches most closely, especially if you already have risk factors like high blood pressure, diabetes, or a family history of heart disease.
Why HDL Cholesterol Is Protective
HDL works in the opposite direction: it picks up excess cholesterol from your bloodstream and carries it to your liver, where it’s processed and removed from the body. Higher HDL is generally better — some simple, evidence-backed ways to raise it include:
- Regular aerobic exercise, like brisk walking, swimming, or cycling
- Replacing saturated fats with unsaturated fats — olive oil, nuts, and avocado are common examples
- Quitting smoking, which lowers HDL and damages blood vessel walls
A Simple 3-Step Plan to Track Your Cholesterol
- Get screened regularly. The AHA recommends a lipid panel every 4–6 years starting at age 20, though your doctor may suggest more frequent testing if you have risk factors.
- Compare your results to cholesterol levels by age chart above. This gives you context — are you in line with your age group, or trending toward a category that needs attention?
- Talk to your doctor about next steps. They’ll factor in your full health picture — not just age — to decide whether lifestyle changes, closer monitoring, or medication make sense for you.
Diet and Lifestyle Habits That Influence Cholesterol
Small, consistent habits tend to move the needle more than any single “superfood.” A few habits with strong evidence behind them:

- Choose unsaturated fats over saturated and trans fats. Red meat and full-fat dairy are common sources of saturated fat; fried and processed snack foods often contain trans fats. Swapping in nuts, seeds, and plant oils can help shift your LDL/HDL balance.
- Add more soluble fiber. Oats, beans, lentils, and fruits like apples and pears can reduce how much cholesterol your gut absorbs.
- Stay physically active. Even modest activity — a daily 30-minute walk, taking the stairs, or a weekend bike ride — helps raise HDL and support healthy triglyceride levels.
- Manage stress. Chronic stress raises cortisol, which can indirectly push cholesterol levels up over time. Techniques like deep breathing, meditation, or simply spending time outdoors can help.
- Quit smoking. Cholesterol and circulation both tend to improve within months of quitting.
When Diet and Exercise Aren’t Enough: Medication
For some people, lifestyle changes alone don’t bring LDL down to a safe range — particularly if genetics play a strong role. In these cases, doctors may recommend a class of medications called statins, which reduce the amount of cholesterol your liver produces and help it clear more LDL from your blood. If lifestyle changes alone aren’t enough, newer options are also emerging — for example, Merck’s Lipfendra, the first oral PCSK9 inhibitor, was approved by the FDA in 2026 as an alternative to traditional statins. Statins are typically prescribed alongside — not instead of — a heart-healthy diet and active lifestyle.
If you’re prescribed a statin or another cholesterol medication, it’s worth asking your doctor:
- What are my target LDL and HDL levels?
- What side effects should I watch for?
- How long will I likely need to take this medication?
- Are there non-statin alternatives that might fit my situation better?
Common Cholesterol Myths, Debunked
Myth: Eating high-cholesterol foods (like eggs) directly raises your blood cholesterol. Fact: For most people, dietary cholesterol has a smaller effect than once believed — your liver adjusts its own production based on what you eat. Saturated and trans fats generally have a bigger impact on blood cholesterol than cholesterol itself.
Myth: All dietary cholesterol is equally harmful. Fact: The type of fat accompanying the cholesterol in a food — saturated versus unsaturated — matters more than the cholesterol content alone.
Myth: If I eliminate cholesterol from my diet entirely, my risk drops to zero. Fact: Your body needs some cholesterol to produce hormones and build healthy cells. The goal is balance, not elimination.
Myth: A healthy diet guarantees healthy cholesterol. Fact: Genetics play a real role — some people inherit conditions like familial hypercholesterolemia that keep LDL elevated regardless of diet. If your numbers stay high despite consistent healthy habits, that’s a conversation for your doctor, not a sign you’re doing something wrong.
Conclusion
Cholesterol naturally shifts as you age, and understanding those patterns — for your sex and age group specifically — makes it much easier to interpret your own lab results. Use the cholesterol levels by age chart above as a general reference point, keep up with regular screenings, and treat your doctor as a partner in setting the targets that make sense for your specific health picture. Small, consistent habits around diet, exercise, and stress management remain the foundation of healthy cholesterol at any age.
FAQ
Why does a cholesterol levels by age chart matter if there are general guidelines for all adults? General AHA/JACC categories (optimal, borderline, high) apply to all adults, but average cholesterol naturally differs by age and sex due to hormonal and metabolic changes. Comparing your results to your specific age group gives useful context alongside the general categories.
Do I really need to fast before a lipid panel? Yes, in most cases. Fasting for 9–12 hours (water only) helps ensure your triglyceride and LDL readings are accurate, since eating beforehand can temporarily raise these numbers.
What are the AHA/JACC 2018 guidelines? They’re cholesterol risk categories published jointly by the American Heart Association and the American College of Cardiology in 2018, based on extensive cardiovascular research. Most U.S. doctors use these categories to assess heart disease risk.
What counts as a “good” total cholesterol level? Under 200 mg/dL is considered optimal for most adults. Between 200–239 mg/dL is borderline high, and 240+ is considered high risk.
Can lifestyle changes actually lower LDL cholesterol? Yes. Reducing saturated fat intake, increasing soluble fiber, exercising regularly, and quitting smoking are all evidence-backed ways to improve your LDL and HDL numbers over time.
When might a doctor recommend a statin? If lifestyle changes alone don’t bring your LDL to a safe range — especially for people with a strong genetic predisposition or existing heart disease — doctors may recommend statin therapy alongside continued healthy habits.
Should my HDL be as high as possible? Generally, higher HDL (60 mg/dL or above) is protective. You can support healthy HDL levels through regular exercise, unsaturated fats, and not smoking.